
Tags
ArkwoodAR, Depth Map, Disparity, Epiline, Epipolar Constraint, Epipolar Geometry, Epipolar Plane, Epipole, FLANN, Fundamental Matrix, OpenCV, Python, SIFT, Stereo Images
I’ve been using stereo images for ArkwoodAR, a Python Augmented Reality application for Google Cardboard:

The left image is from the perspective of my left eye, and the right image is from the perspective of my right eye. With stereo images, I am able to provide natural visual depth when viewing the Augmented Reality through the Google Cardboard glasses.
If I only used one webcam with the application, instead of two, then each eye would be served the same image and there would be no natural visual depth. I could still use the application – it just wouldn’t feel as real.
But can the visual depth of objects be calculated using stereo images? And, if so, how can we display this information? Let’s find out…
Epipolar Geometry
Epipolar Geometry allows us to determine the depth of objects, using stereo images. For example, here is an image of two DVD cases, shot from the left-hand side:

And here are the same two DVDs (The Big Lebowski and Ramones It’s Alive 1974-1996) shot from the right-hand side:

Note that the two shots are much wider than a set of human eyes would be, but they will do well to illustrate Epipolar Geometry.
The OpenCV Epipolar Geometry tutorial explains how – with the use of epilines – we can use the right image to work out the depth of objects in the left image, and vice versa.
Here’s the result of running the tutorial’s Python code against my left and right DVD images:

The epilines of the right image are drawn on the left image, and the epilines of the left image are drawn on the right image.
We can now determine the depth of objects in the left image with the help of the right image, and vice versa.
Note: I had to make alterations to the tutorial code, in order to get it working with OpenCV 2.4.9
The pts1 and pts2 parameters required to be converted to floats:
F, mask = cv2.findFundamentalMat(pts1.astype(float),pts2.astype(float),cv2.FM_LMEDS)
lines1 = cv2.computeCorrespondEpilines(pts2.reshape(-1,1,2).astype('float32'), 2,F)
lines2 = cv2.computeCorrespondEpilines(pts1.reshape(-1,1,2).astype('float32'), 1,F)
And the line and circle functions do not assign a return value:
cv2.line(img1, (x0,y0), (x1,y1), color,1)
cv2.circle(img1,tuple(pt1),5,color,-1)
cv2.circle(img2,tuple(pt2),5,color,-1)
Depth Map from stereo images
Okay, so Epipolar Geometry allows us to calculate the visual depth of objects. Let’s now have a look at how we can display a depth map from stereo images.
Here’s two webcams attached to Google Cardboard glasses, for use with the ArkwoodAR Python Augmented Reality app:

The two webcams are spaced apart, just as a set of human eyes are.
Here’s an image from the left webcam, of a guitar:
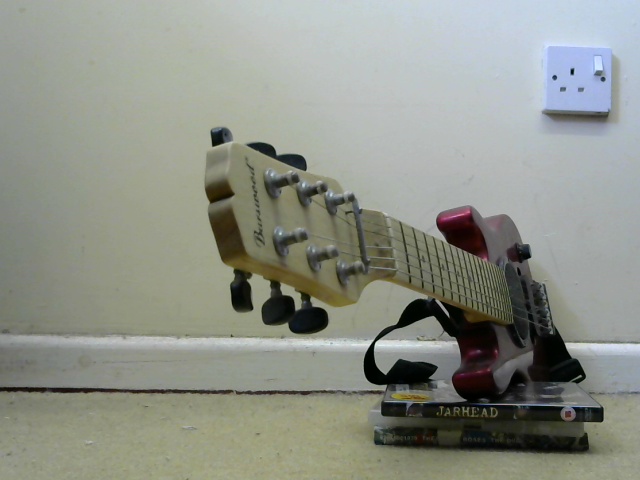
And here’s an image from the right webcam, of the same guitar:

The OpenCV Depth Map from Stereo Images tutorial explains how the disparity between these two images allows us to display a depth map.
I ran the Python code in my OpenCV 2.4.9 sample folder ‘opencv\sources\samples\python2\stereo_match.py’ – which is also available online – to create the following depth map from my left and right guitar images:

The head of the guitar – including the tuning pegs – is at the centre of the depth map, with the guitar fretboard and body behind it.
The code can be tweaked to reduce noise and provide better results. I increased the window size from 3 to 7 and the minimum disparity from 16 to 32:
window_size = 7
min_disp = 32
Look again at the left and right guitar images…
Notice how an object at the back of the picture – such as the plug on the wall – does not have much disparity between the left and right images i.e. the plug does not shift much between shots.
But notice how an object at the front of the picture – such as the head of the guitar – does have a lot of disparity between the left and right images i.e. the guitar head in the left shot is pretty much centre, whilst in the right shot it shifts to the far left.
The amount of disparity between objects in our left and right stereo images allows us to determine to what degree they are in the foreground or background. Indeed, the depth map displays this information by making the objects closest to the webcams as a bright white, whilst the objects further away as a dark grey.
As we follow the guitar from its head back along its neck to its body, we can see the depth map get progressively darker.
Note: the code also generates a 3D point cloud – the resulting .ply file can be viewed using MeshLab:

Summary
So there we have it, Epipolar Geometry and Depth Map can determine and display visual depth of objects, using stereo images.
Of course, there are many cues in a single image which would tell us if the object is in the foreground – such as overlapping, lighting and shading, and familiar size. Armed with a stereo image, however, we can use the techniques in this article to calculate its depth.
As Dr Burton would say, the demonstration has been quite sufficient.
Ciao!

Hi,
I would like to know, how to calculate the depth using lines1 and lines2. The tutorial does not explain how to do it. Thank you!
Hi. Just the visual disparity, I’ve not tried any distance calculations.
Hi, thank you very much for your response. Using the tutorial’s code I am not able to reproduce that disparity map. Can you provide the full code so I can test and see what I am doing wrong? Thank you again!
And, as far as you know, is it possible to calculate the depth using only the epipolar geometry?
The code I used for the depth map is here, based on the second tutorial here (note I’m using OpenCV 2.4.9). Sorry, haven’t tried calculating distance but some stuff online.
Ok, thank you. As far as you know the two images should be rectified?
The depth maps in this post and here are rough and ready with two webcams, which works quite well. I’d imagine for an accurate distance calculation you’d be looking at calibration etc, don’t know any more on it though 🙂
Thank you! Great post.
is the depth and orthogonal distance between epipolar line and feature point is same
The left and right images of the DVDs are not exactly the same distance away on either side, just roughly.
Pingback: Reconstructing 3D Models from The Last Jedi – Terence Eden's Blog
hey, i have a small doubt is the disparity map necessary during sparse reconstruction
Do you mean the generation of the .ply file, which is part of the depth map code?
Can you advice me how to start to learn stereo-imaging?
Hi. Is there any particular use you have in mind for stereo images? Done a couple of posts that might help: Depth perception: monocular and binocular cues, Stereoscopic images with OpenGL
I’ve actually been putting together stereoscopic videos, shot in VR. The videos can then be played back through the VR headset, to get the 3D effect.